
Which Real Estate Investor CRM Has the Best Reporting? The KPIs and Dashboards to Track

In This Guide
The CRM with the best reporting is the one that tracks every deal from marketing dollar to closed deal, by rep, without spreadsheets. REsimpli has KPI dashboards, CarrotCRM has rep scorecards, and Left Main REI, a CRM and growth operating system for real estate investment teams, includes ready-made dashboards for every department in your business with industry-standard reference ranges. Leadership, Marketing, Lead Management, Acquisitions, Dispositions, and Transactions.
Which numbers should you track first?
Track the numbers that tie to a deal, revenue or profit, each with an owner on the team. Website traffic, follower counts, email open rates, total leads and even raw deal count can all rise while profit falls. As we wrote in Vanity Metrics vs. Real Estate KPIs, ten deals netting $2,000 each is a worse business than five deals netting $15,000 each.
Benchmarks help you spot problems, not set targets. Left Main’s reference ranges (from our 2026 benchmarks post) for wholesaling: lead-to-deal conversion of about 1–3%, cost per lead from roughly $20 for cold outreach to $150+ for paid channels, and 2–5 deals a month for a solo full-time operator once systems run smoothly. For fix and flip: gross margins of about 15–30% and roughly 4–9 months from acquisition to sale. Your market will differ. Know your own numbers.
Marketing KPIs
Marketing’s job is to buy deals profitably, not to generate leads. Track:
- Cost per lead by source. Total spend on a channel divided by leads from that channel. Useful only alongside the next three.
- Cost per qualified lead. Leads that fit your buy box, so a cheap channel full of unmotivated sellers doesn’t look like a winner.
- Cost per acquisition (cost per deal). Spend divided by signed or closed deals, by channel and campaign. This is the number that decides budget.
- Lead source ROI. Revenue (or profit) from deals attributed to a source, against what that source cost.
- True lead-source conversion. Many leads you lose still sell, to someone else. Knowing which sources produce sellers who actually sell, even when you didn’t buy, tells you whether the channel or your follow-up is the problem.
Acquisitions KPIs
Acquisitions turns leads into contracts. Every metric should be visible by rep, by source and by week:
- Speed to lead. Time from a lead arriving to first real contact. Our benchmarks post notes consistent closers respond within minutes.
- Contact rate. Share of new leads reached at all.
- Lead → appointment → offer → contract conversion. Track each step separately. A rep with a strong appointment rate and weak offer-to-contract rate needs different coaching from one who can’t get appointments.
- Follow-up compliance. Are scheduled touches actually happening? Many deals come from month three, not day one. One Left Main client put it this way: “He got a deal from literally the system following up for three months consistently.”
- Lost-deal reasons. Why leads die (price, timing, went with another buyer, listed with an agent) is as useful as why they convert.
See what this looks like in your own pipeline.
Dispositions KPIs
Dispo turns contracts into revenue. Track:
- Interested Buyers Per Deal. How many buyers expressed any interest at all in this property.
- Interested Buyers to Offer Ration How many interested buyers made an offer.
- % Marketing Price to Assignment Price How close did you get to predicting the proper marketing price for this property.
- Days to assign or sell. From contract signed to assignment or buyer under contract. Rising days usually mean pricing or buyer-list problems.
- Buyer response. How many buyers interact with your listing, open or reply to emails, or respond to SMS’s.
- Assignment fee or spread per deal. Average and by property type or market.
- Fall-through rate. Deals that cancel after contract, and why.
- Active buyer depth. How many verified, recently active buyers you have for a given area and property type.
Leadership KPIs
Owners need a short list they review every week:
- L10 scorecard. If you run EOS, your Level 10 meeting scorecard should pull straight from the CRM: Each department’s weekly numbers, each with an owner and a target. Lead to Opportunity, Opportunities with Attended Appointments, Attended Appointments with Offers, Offers to Accepted, Contract to Revenue. Typing these into a spreadsheet every Monday is a sign your reporting is broken.
- Deal velocity. Average days from lead to contract and from contract to close, and how many deals are moving through each stage.
- ARV accuracy. Your estimated after-repair value against the actual resale price. Consistent overestimates cost real money on flips and hurt your reputation with buyers on wholesales.
- Revenue per team member. Net revenue divided by headcount. It shows whether new hires are adding output or just cost.
- Average profit per deal and net revenue per deal. The counterweight to deal volume.
What should a CRM’s reporting be able to do?
Most reporting problems are data problems. A CRM can only report what it captures. Before you compare dashboards, check that the system can:
- Keep the whole deal in one record. Marketing source, every call and text, offers, contract, dispo and closing should live on one record. If acquisitions works in one tool and dispo in another, cost per acquisition and deal velocity become guesswork.
- Capture activity automatically. Calls, texts and emails sent from inside the CRM log themselves. Reports built on manual entry decay fast.
- Attribute spend to source and campaign. Without cost data tied to lead source, you can count leads but not ROI.
- Break every metric down by rep, source, market and date. A company-wide average hides the problem.
- Let you build your own reports. Your L10 scorecard won’t match anyone’s template exactly.
How Left Main approaches reporting
Left Main REI is a CRM and growth operating system for real estate investment teams that have outgrown their tools. Built natively on Salesforce by real estate operators, it is one system to find, run, and close every deal, so teams move faster, win more, and see exactly what’s working.
For reporting, that means:
Dashboards built by operators. Standard dashboards include L10 metrics, cost per acquisition, deal velocity, ARV accuracy, marketing ROI and team performance, plus automated prioritization of who to call.
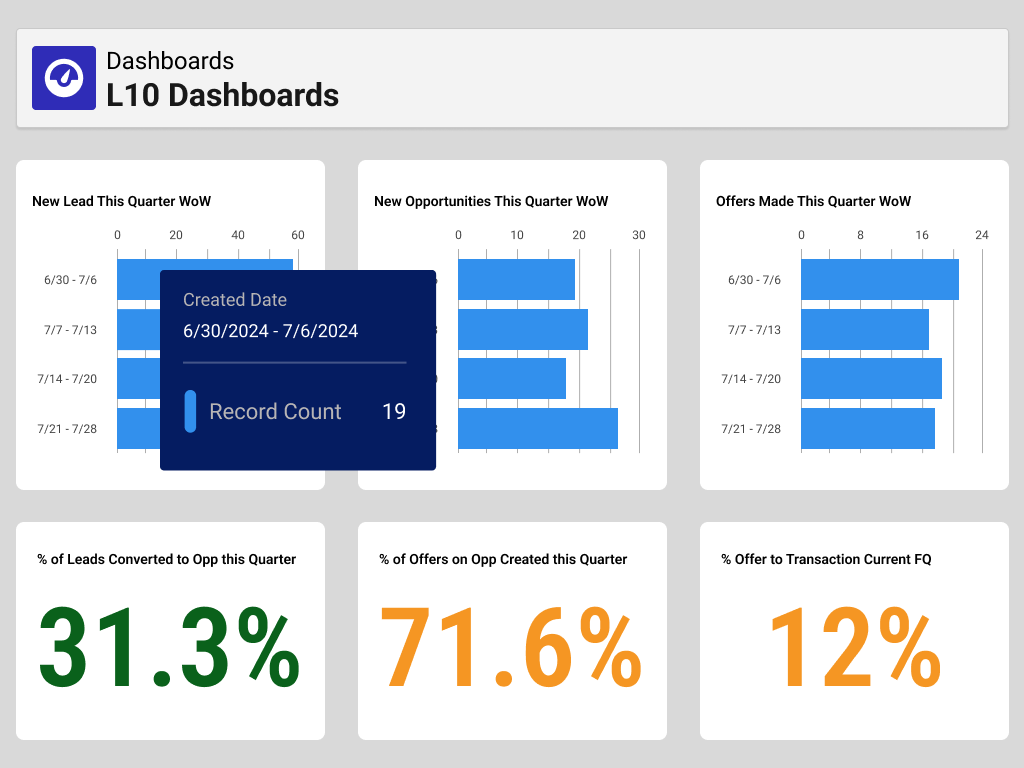
L10 dashboards: new leads, opportunities and offers this quarter, with conversion rates. Image: leftmainrei.co

Left Main dashboards in action: L10 metrics, acquisitions scorecard, sales and transaction pipelines, marketing by lead source, and cost per lead, opportunity and transaction.

DispoSignals predicted ARV range from comps (used to check ARV estimates). Image: leftmainrei.co
Customizable reports for every department, on Salesforce’s reporting engine, so you can build your own scorecard instead of exporting to spreadsheets. See Left Main features.
One system for the whole deal. Lead management, Cadence Library follow-up, built-in calling, SMS, email and direct mail, dispositions and transaction management all write to the same records, so marketing, acquisitions and dispo report from the same data. Calling and SMS run through a phone account you connect from a Left Main partner or your own phone system, billed by your provider.
True lead-source conversion. Property Sales AI matches county sale records to your leads, closes out the ones that sold, shows who bought them and reports true lead-source conversion. Weekly reports include Lost Leads by Source and Lost Opps by Offer Difference (your last offer vs. the actual sale price).
Find the revenue you’re missing. DealSignals tracks 12 stress indicators across up to 100,000 property records a month. It flags existing leads when a signal appears and delivers newly distressed properties in your market to the CRM as net-new prospects. DispoSignals shows buyer demand, investor and retail comps, and up to 30 verified buyers per property.
As one Left Main client summed it up: “Everything in one place.”
Pricing (leftmainrei.co/pricing): Starter is $500/month plus $3,000 implementation and includes dashboards and reports. Launch is $1,200/month, implementation included, and adds DealSignals or DispoSignals plus Property Sales AI. Enterprise is $2,000/month, premium implementation included, with DealSignals and DispoSignals plus the Investor Portal. Salesforce licensing is included in every plan, and QuickBooks connects on all plans. You can start using Left Main right after purchase; data migration and integration setup take up to 30 days.
How do Left Main, REsimpli, CarrotCRM, Podio and GoHighLevel compare on reporting?
Competitor details come from each vendor’s own pages (checked Oct 17, 2026). Confirm current details with each vendor before buying.| Tool | Built for | Ready-made investor KPIs | Rep / team reporting | Custom reports | Published starting price |
|---|---|---|---|---|---|
| Left Main REI | Real estate investment teams that have outgrown their tools; built on Salesforce | Ready-made dashboards for every department in your business with industry-standard reference ranges. Leadership (aka L10), Marketing, Lead Management, Acquisitions, Dispositions, Transactions, marketing ROI; true lead-source conversion with Property Sales AI (pricing, Property Sales AI) | Team performance dashboards | Customizable reports and dashboards for every department (features) | Three plans; see pricing above |
| REsimpli | Real estate investors; “Every feature on every plan” (pricing) | Speed to Lead, Appointment Set Rate, Offers Made, Contracts Signed, Cost Per Deal, Best ROI, Average Profit/Deal (KPI dashboard); cost per lead through cost per deal on the CEO Dashboard (help center) | Goal Tracker filters by user, source, campaign and date (KPI dashboard) | Not described on the pages checked | Solo $249/month billed annually (pricing) |
| CarrotCRM (formerly InvestorFuse) | Investors, from solopreneurs to high-volume teams (CRM features) | Daily activities, average touches per opportunity, average time to contract, contract-to-close ratio, deal source tracking (CRM features) | My Scorecard on all paid plans; Employee Scorecard on Team per the comparison table; TV KPI Dashboard on Team annual (pricing) | Not described on the pages checked | Essential $69/month; Scale $179; Team $349 (pricing) |
| Podio | General work-management platform you configure yourself | None built in; you build apps, filters and reports (filters and reports) | Via saved views and sub-groups (up to 15 sub-groups per view) (filters and reports) | Standard reporting for all organizations; visual reports (table, bar, line) on the Premium tier (visual reports) | Free; Plus $11.20/user/month billed annually; Premium $19.20 (pricing) |
| GoHighLevel | Agencies, marketers and small businesses (pricing) | Not investor-specific | “User/Agent Reporting” on Agency Pro (pricing) | “Custom Dashboards & Reporting” in core features from Starter (pricing) | Starter $97/month; Unlimited $297; Agency Pro $497 (pricing) |
A few notes on the comparison
- REsimpli ships a long list of investor KPIs out of the box and lists Full Accounting as a feature (pricing, checked Oct 17, 2026). Its help center says net profit on the CEO Dashboard requires the REsimpli Banking integration (help center, checked Oct 17, 2026).
- CarrotCRM is strong on rep activity and scorecards, and a natural fit if you already run Carrot websites.
- Podio can report on almost anything you model, but you build and maintain it. Text fields can’t be filtered directly (filters and reports, checked Oct 17, 2026). A former Left Main client compared the two this way: “You can grow into Left Main better than you can grow into something like Podio.”
- GoHighLevel offers custom dashboards on every plan, but it is a general marketing platform, so investor KPIs like ARV accuracy or days to assign are yours to set up.
Who should choose which
- Choose REsimpli if you’re a solo investor or small team that wants investor KPIs and accounting in one lower-cost tool and doesn’t need deep or custom reporting.
- Choose CarrotCRM if you already use Carrot for websites and lead generation and want rep scorecards at a low monthly price.
- Choose Podio if you’re a solo investor or small team and have someone who enjoys building & maintaining systems and you’re willing to maintain your own reports.
- Choose GoHighLevel if your business is mostly marketing funnels and you don’t need a dedicated acquisitions and dispo pipeline.
- Choose Left Main if you run separate marketing, lead management, acquisitions and dispo roles, want your data and metrics to come straight from the CRM, and are planning to add people or markets. Left Main serves teams from 5 deals a month to 200+. If you’re doing a deal or two a month on your own, a simpler, cheaper tool is probably the better fit for now.
For examples of teams that grew on Left Main, see how ProSource Home Buyers scaled from 10 to 50+ deals per month and how Oak Hill Solutions turned foreclosures into $574K in revenue. More by strategy: Left Main for residential investors.
FAQ
Which real estate investor CRM has the best reporting?
It depends on what you need to see. REsimpli has ready-made investor KPI dashboards, CarrotCRM is strong on rep scorecards, Podio and GoHighLevel let you build your own, and Left Main gives growing teams operator-built dashboards (L10, cost per acquisition, deal velocity, ARV accuracy) on customizable Salesforce reporting.
What KPIs should a wholesaling company track?
Cost per lead and cost per acquisition by source, speed to lead, lead-to-appointment-to-offer-to-contract conversion by rep, days to assign, assignment fee per deal, and fall-through rate. Leadership should add deal velocity and revenue per team member.
What is a good lead-to-deal conversion rate for wholesalers?
Left Main’s reference range for wholesaling is about 1–3%. Use it to spot problems, not as a target; track your own rate by source and rep.
How do I measure ARV accuracy?
Record your estimated ARV when you make an offer, then compare it with the actual resale price once the property sells. Track the gap by rep and market over time. Left Main’s ARV accuracy dashboard does this for you, comparing each rep’s estimated ARV with what the property actually sold for.
Can I just use spreadsheets for KPIs?
You can at low volume, but spreadsheets depend on someone copying data in by hand, and they break when you add reps or markets. If your weekly numbers take hours to assemble, it’s time for a CRM that reports them directly.
Related: Best CRM for Real Estate Investors: 2026 Buyer’s Guide · How to Tell Which of Your Leads Sold to Another Investor · When to Switch Real Estate CRMs (and How to Do It Without Losing Leads)
See your own numbers on one screen: book a Left Main demo. Or take Left Main for a test drive on your own at leftmaindemo.com.
Can I export Left Main dashboards?
Yes. You can export dashboards or you can directly display them on screens around your office.
Sources
As of Oct 18, 2026
- Left Main REI, Vanity Metrics vs. Real Estate KPIs: https://leftmainrei.co/vanity-metrics-vs-real-estate-kpis/
- Left Main REI, Real Estate Benchmarks for 2026: https://leftmainrei.co/real-estate-benchmarks-for-2026-and-how-investors-are-actually-tracking-them/
- Left Main REI pricing: https://leftmainrei.co/pricing/
- Left Main REI features: https://leftmainrei.co/real-estate-crm-features-2/
- REsimpli pricing: https://resimpli.com/pricing/
- REsimpli KPI dashboard: https://resimpli.com/features/kpi-dashboard/
- REsimpli help center, KPI Dashboards Overview (CEO Dashboard): https://help.resimpli.com/en/articles/11504786-kpi-dashboards-overview-ceo-dashboard
- CarrotCRM features: https://carrot.com/features/crm
- CarrotCRM pricing: https://carrot.com/investorfuse-pricing/
- Podio documentation, Filters and Reports: https://www.progress.com/podio/documentation/using-podio/using-apps/filters-and-reports
- Podio documentation, Visual Reports: https://www.progress.com/podio/documentation/using-podio/using-apps/visual-reports
- CarrotCRM plan prices: https://carrot.com/crm-pricing/
- Podio pricing (Progress): https://www.progress.com/podio/pricing
- HighLevel pricing: https://www.gohighlevel.com/pricing
Your next deal, right at your fingertips.
See Left Main on your own pipeline. Book a demo, or take a self-guided test drive.

Stop chasing. Start closing.
Serious investors choose Left Main REI to scale faster, close more deals, and dominate their markets.
Your next deal, right at your fingertips.